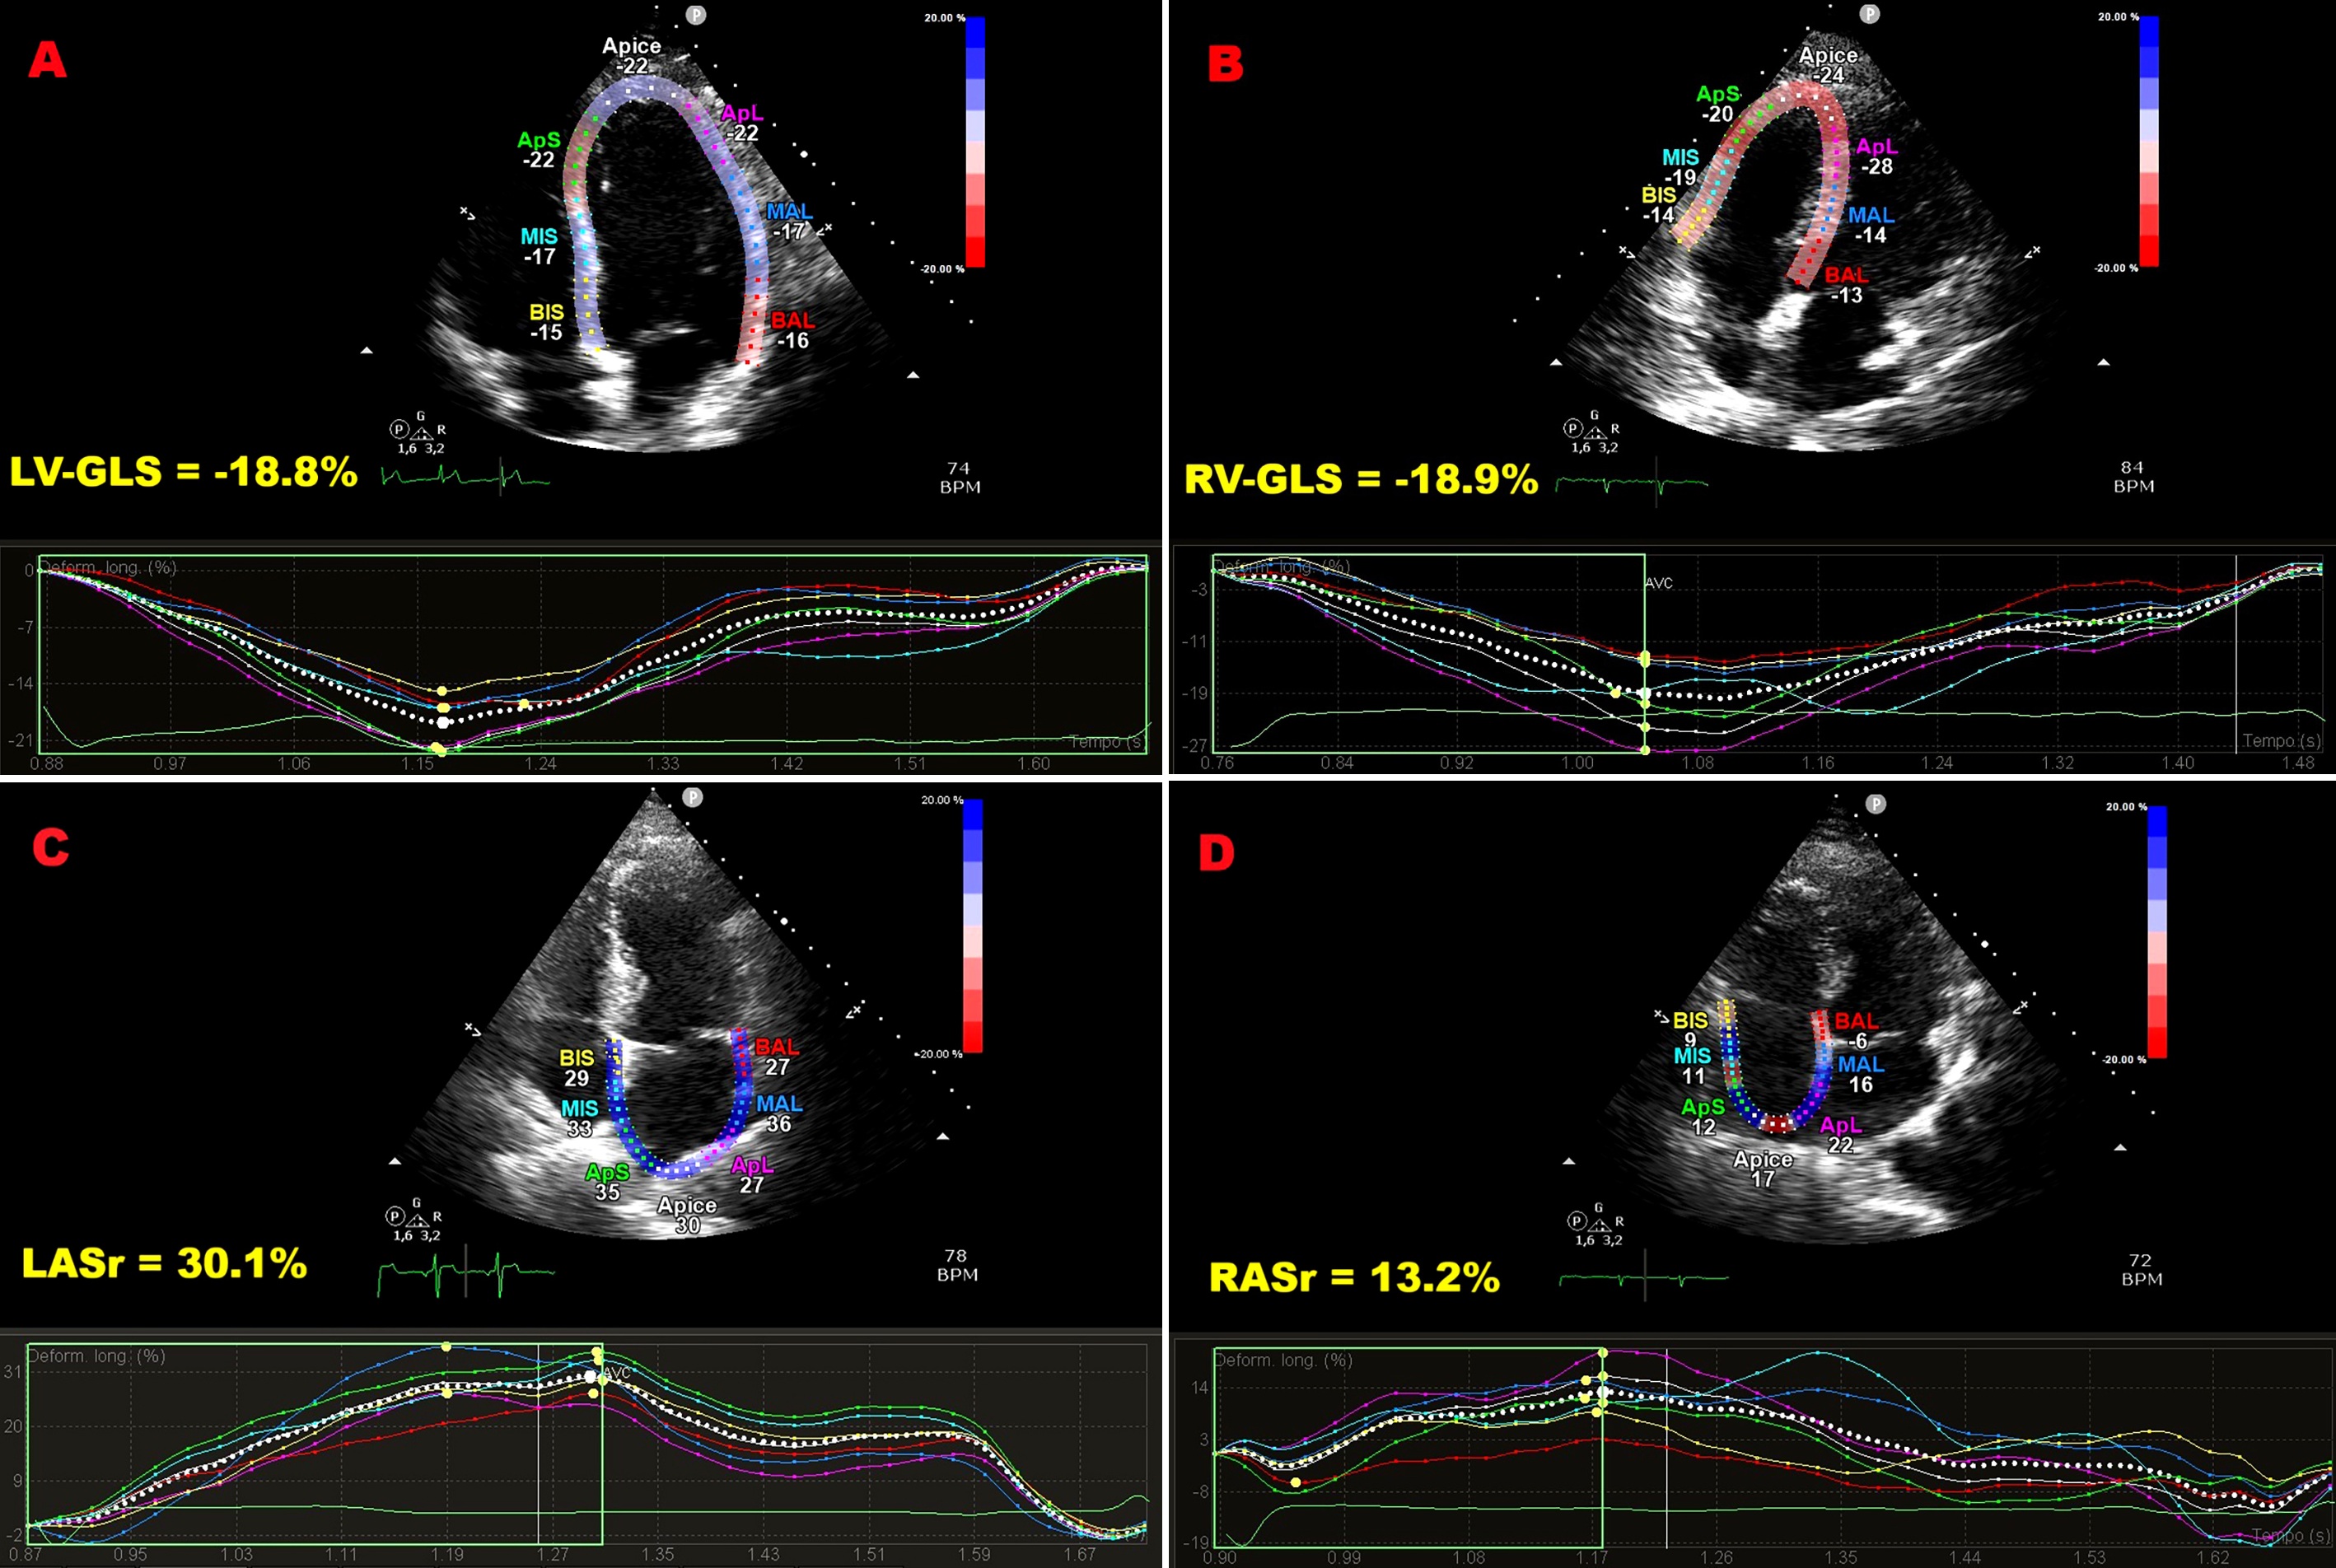
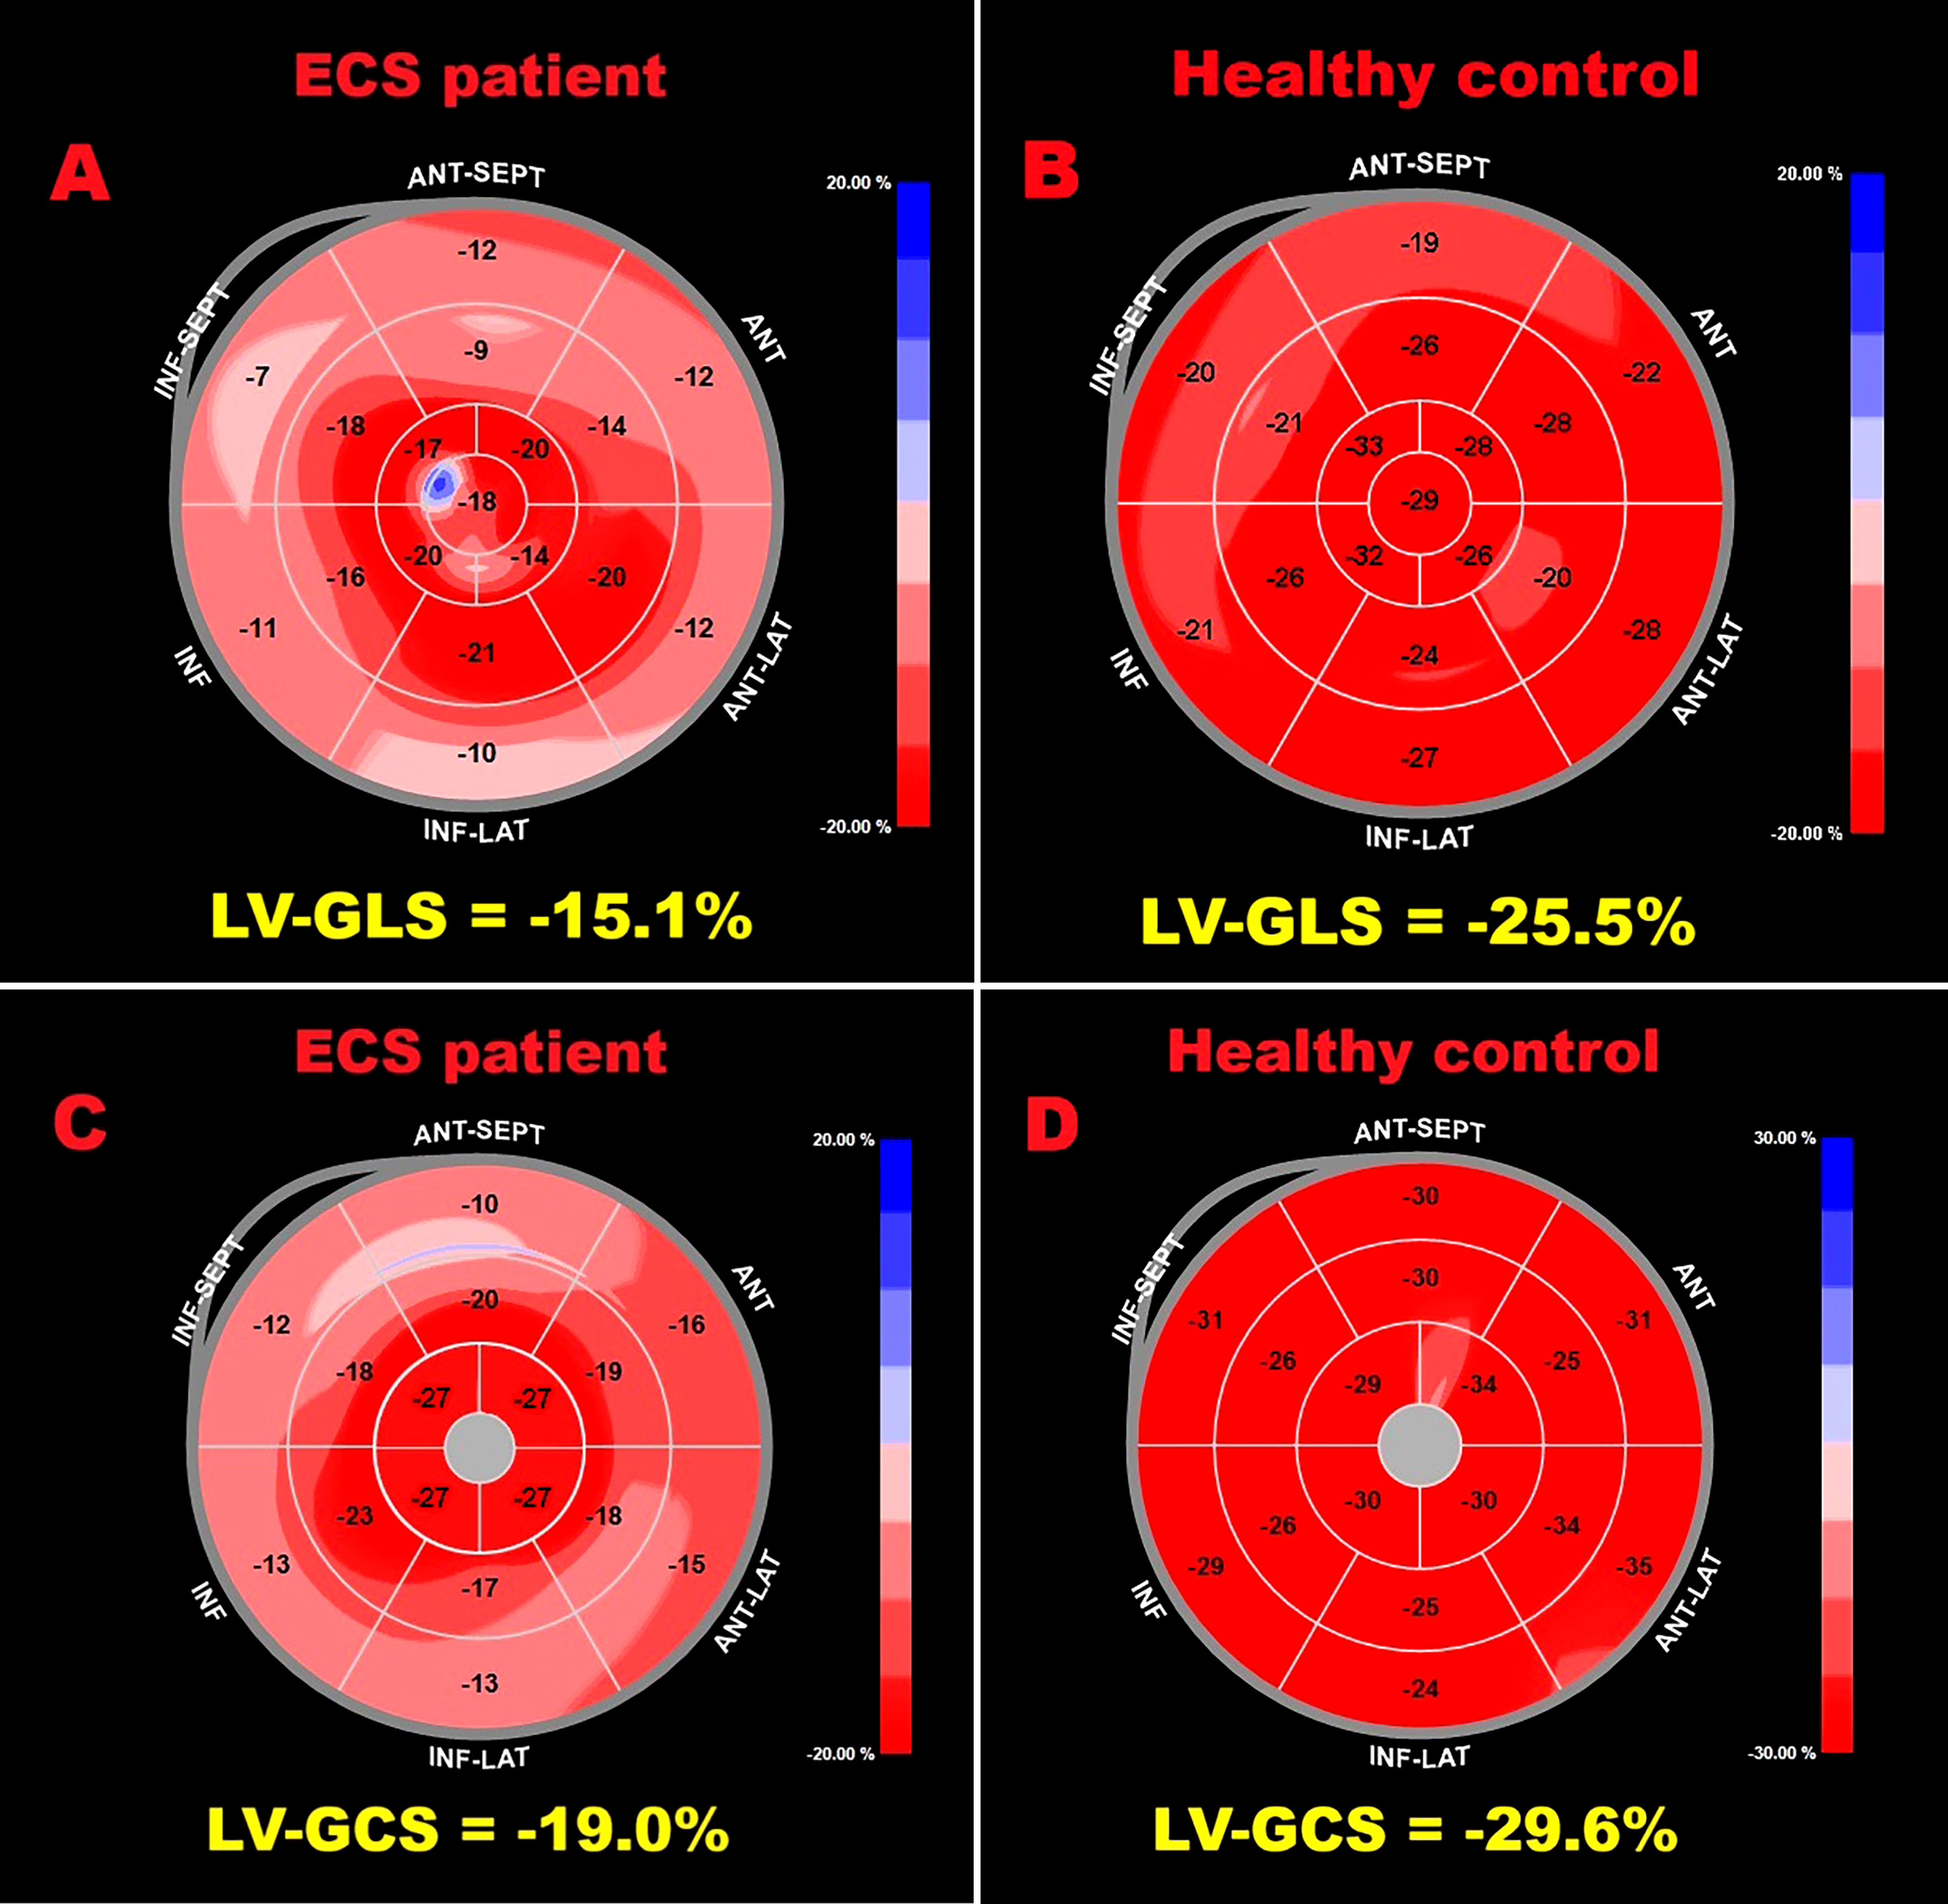
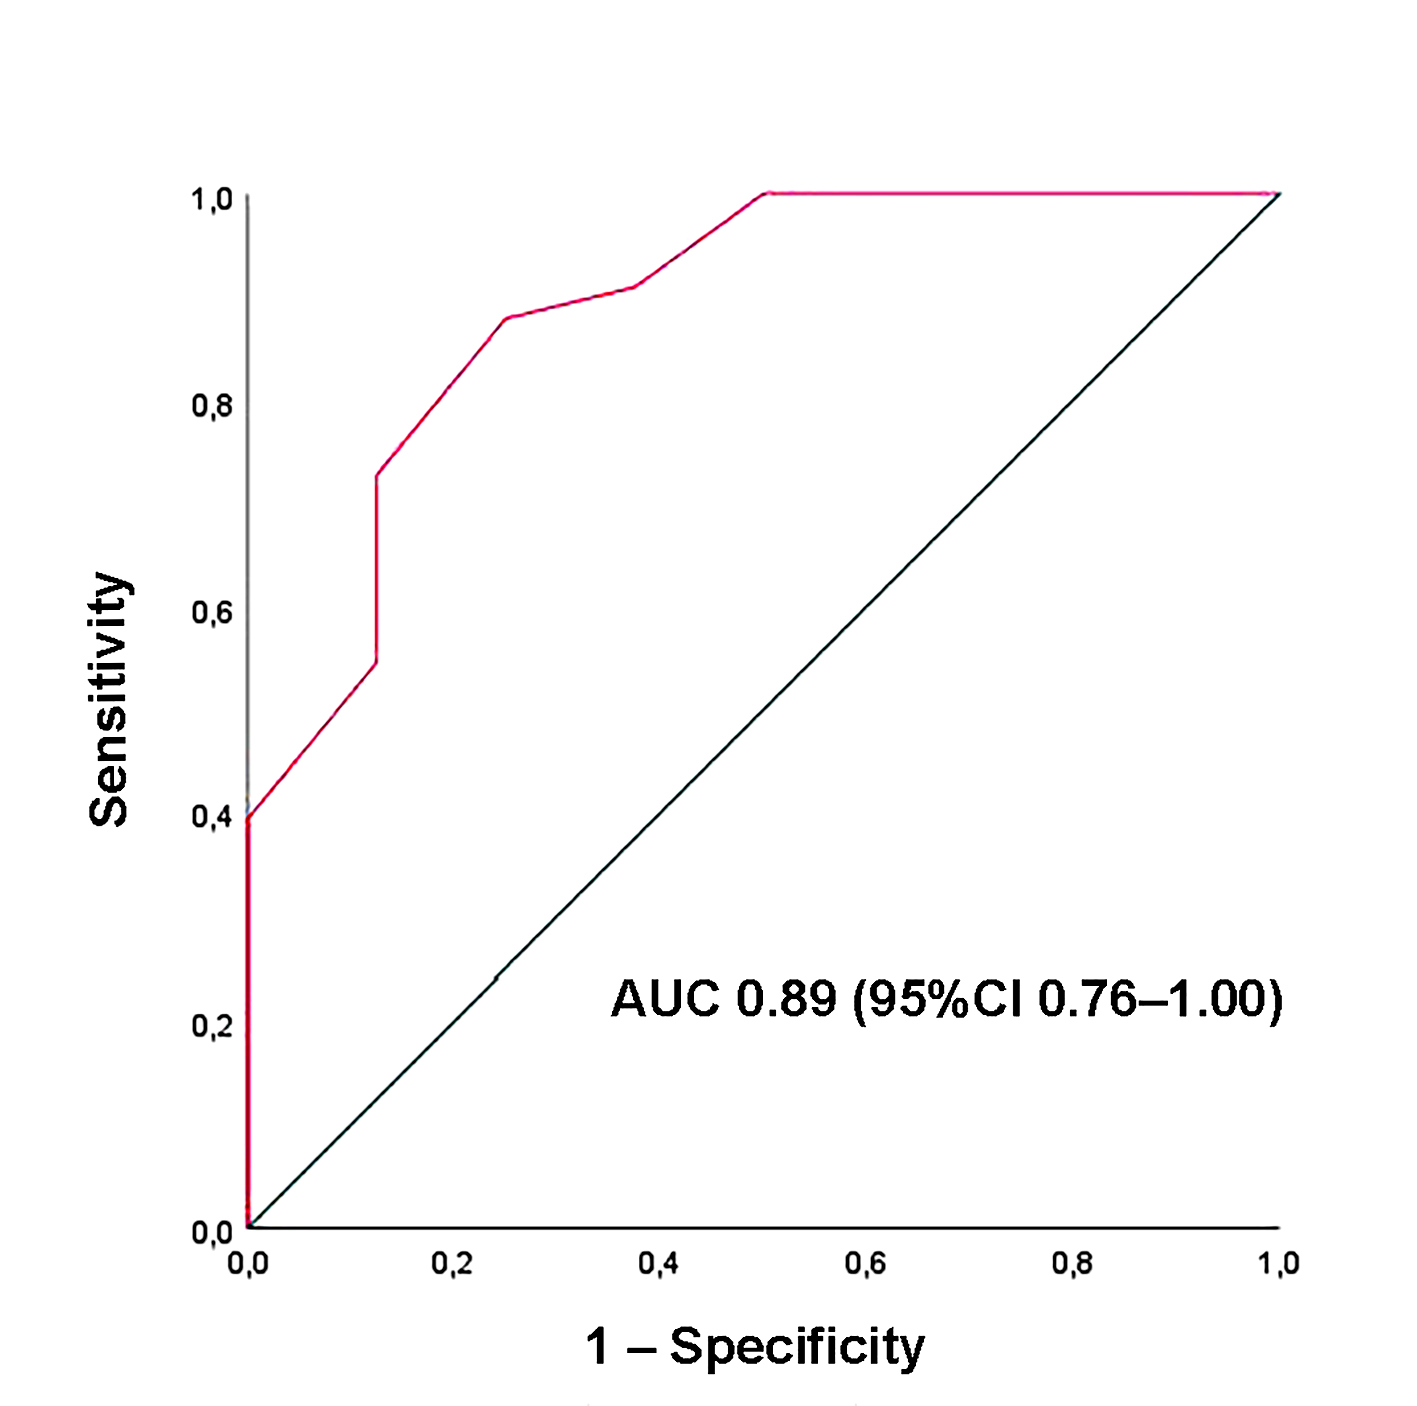
Background: Speckle-tracking echocardiography (STE) has been increasingly used to uncover subtle cardiac dysfunction in patients with extracardiac sarcoidosis (ECS) who show no clinical evidence of heart disease. However, prior investigations were mostly retrospective, methodologically heterogeneous, and focused primarily on left ventricular (LV) function. We conducted a prospective study to provide a broader evaluation of myocardial deformation across both ventricles and atria in non-fibrotic ECS. Methods: Forty-one patients with non-fibrotic ECS (mean age 57.4±10.2 years; 58.5% male) and 30 age- and sex-matched healthy controls (58.5±11.1 years; 53.3% male) were enrolled. All participants underwent conventional transthoracic echocardiography (TTE) supplemented by comprehensive STE analysis of ventricular and atrial function. Subclinical myocardial dysfunction was defined as LV global longitudinal strain (GLS) less negative than –20%, and potential predictors were analyzed. Results: Standard TTE excluded infiltrative cardiomyopathy but revealed higher E/average e′ ratios in the ECS group, suggesting subtle diastolic dysfunction. While traditional indices of biventricular systolic function remained preserved, STE demonstrated significant reductions in LV-GLS, LV global circumferential strain, right ventricular-GLS, and both left and right atrial reservoir strain. Multivariate analysis identified disease duration as the sole independent determinant of LV-GLS impairment (OR 2.26, 95%CI 1.10–4.65; p=0.03). A disease duration of ≥4.5 years predicted abnormal GLS with 88% sensitivity and 75% specificity (AUC 0.89; 95%CI 0.76–1.00). Conclusions: Non-fibrotic ECS is associated with early impairment of biventricular and biatrial strain despite preserved conventional function. The extent of dysfunction correlates strongly with disease duration, underscoring the value of STE for early detection and monitoring. Figure 1. Illustrative example of LV-GLS (A), RV-GLS (B), LASr (C) and RASr (D) assessment by speckle tracking echocardiography in an ECS patient participating in the present study. Figure 2. Bull’s eye plots derived from 2D-STE illustrating LV-GLS and LV-GCS in an ECS patient (A and C, respectively) and in a healthy control (B and D, respectively). Figure 3. ROC curve analysis performed to determine the optimal cutoff for disease duration in predicting impaired LV-GLS within the ECS cohort.