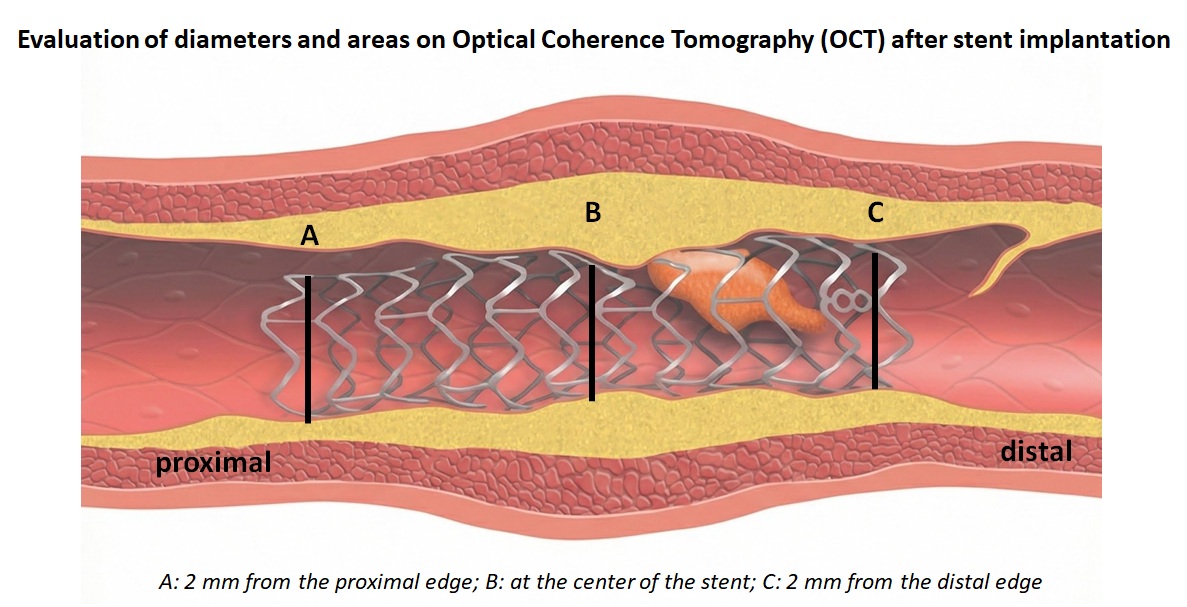
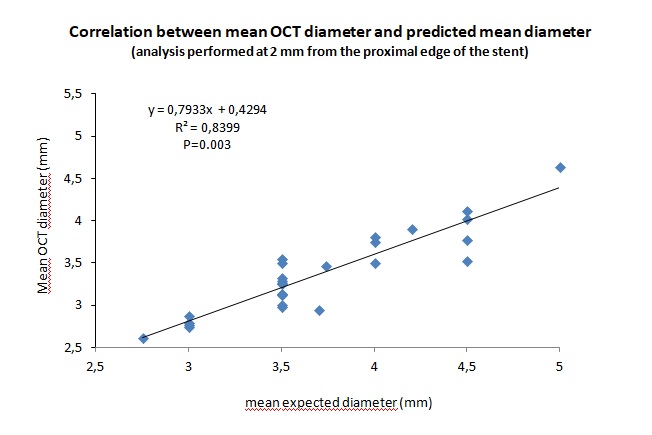
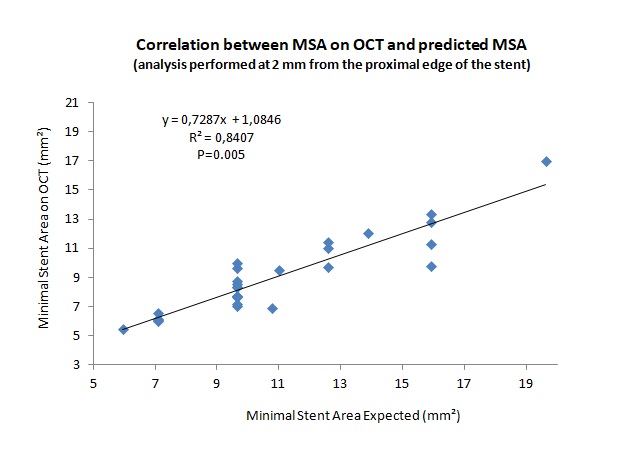
Introduction : OCT is superior to IVUS for assessing correct coronary stent implantation. The few articles in the literature directly comparing OCT and IVUS show an underestimation of OCT diameters and areas from 5 to 14%. The aim of our study is to evaluate the difference between OCT-based diameters and areas obtained after stent implantation compared to expected values. Methods : Between April and December 2025, 27 OCT studies were performed to optimize Percutaneous Coronary Intervention (PCI) with single stent implantation in 26 patients. The mean age of the patients was 70±8 years, with 81% male. PCI was performed for CCS (n=10), NSTEMI (n=7), UA (n=6), completely post-ACS (n=2), and STEMI (n=1). PCIs involved the LAD (n=18), Cx (n=5), CDx (n=3), and Intermediate (n=1). Mean In-stent lumen expansion was 81.85±11.24%; ≥ 70% in 25 of 27 cases. Mean Diameter and MSA analysis were performed at three levels: 2 mm from the proximal edge of the stent (Point A); at the center of the stent (Point B); and 2 mm from the distal edge of the stent (Point C) (Image 1). Results : The mean diameter of the implanted stent was 3.26 ± 0.45 mm, with a mean length of 23.41±8.45 mm. Post-dilation was performed in 89% of cases, 88% of which with a larger balloon size. At Point A, the mean OCT diameter was 8.8±5.3% lower than the mean expected diameter (3.36±0.48 mm vs 3.70±0.56 mm;P=0.021) and the Minimal Stent Area on OCT was 16.4±9.4% lower than the Expected Minimal Stent Area (9.09±2.68 mm² vs 10.98±3.37 mm²;P=0.026); at Point B the mean OCT diameter was 13.3±6.6% lower than the mean expected diameter (3.20±0.57 mm vs 3.69±0.57 mm;P=0.003) and the Minimal Stent Area on OCT was 24.6±11.4% lower than the Minimal Stent Area Expected (8.27±3.19 mm² vs 10.94±3.42 mm²;P=0.005); At Point C, the mean OCT diameter was 13.7±6.9% lower than the mean expected diameter (3.07±0.59 mm vs. 3.55±0.60 mm; P=0.004), and the minimal stent area on OCT was 25.1±11.5% lower than the expected minimal stent area (7.65±3.08 mm² vs. 10.18±3.52 mm²; P=0.007). The highest correlation between mean OCT diameter and mean expected diameter (Pearson R=0.916) and between minimal stent area on OCT and expected minimal stent area (Pearson R=0.917) was observed at Point A (Images B and C). Conclusions : the mean diameter and minimal stent area assessed by OCT are 8.8% to 13.8% and 16.4% to 25.1% lower, respectively. The choice of balloons to optimize stent expansion must take this underestimation into account.